
- Heatwaves are complex events, defined by statistical averages.
- Some evidence exists that heatwaves have increased, but not globally, and not based on good, long term data.
- Institutional science has not helped the public to understand heatwaves, and has mixed the science with political messaging.
Heatwaves are the most intuitive consequence of global warming. But when discussing heatwaves, it is important to distinguish the meteorological data from data relating to impacts. As is shown in other sections, data relating to the social and economic consequences of extreme weather do not show society becoming more vulnerable to extreme temperatures, whether or not they are increasing in frequency, duration or intensity. This article discusses only the evidence and debates between hypotheses relating to the meteorological events.
Another problem confounding our understanding of heatwaves is that unlike most meteorological phenomena, such as rain or storms that are easily characterised, but very much like the concept of climate itself, there is no standard definition of a heatwave. What would be a heatwave in a cold part of the world would be a cold day in a warmer part. So a definition of a heatwave itself requires a normal (or average) and a comparison with that normal.
A further problem is that in the era of mass media and mobile communications, with journalists primed to frame weather events as evidence of catastrophic climate change, a sense of proportion, history and perspective – context – are often lost, easily leading to misunderstandings. For example, in June 2020, a weather station in the Arctic Siberian town of Verkhoyansk recorded a temperature of 38°C – a record high for the town, which created headlines throughout the world and the inevitable speculation about the role of anthropogenic climate change. However, these stories omitted important context from their framing.
First, the temperature record in Verkhoyansk extends only to 1953. Second, a place being within the Arctic Circle (albeit only 100km inside) leads us to imagine that it will be very cold all year round, but this is not the case. London, which at 51.5°N latitude has an average July high temperature of 24°C and a low of 14°C, whereas Verkhoyansk at 67.5°N latitude has an average July high of 22°C and a low of 10°C. The difference between these two latitudes is approximately 1,100 miles. But the greater difference between them occurs in the winter, when the average low for London is 3°C in London in December and January, while it is -48°C in January and February in Verkhoyansk.
An even more interesting difference exists between Verkhoyansk and another location on the same latitude. In the Norwegian island municipality of Røst, the average winter low is just 0°C, but its summer highs are just 14°C. This makes Røst significantly warmer in the winter, on average – 45°C – and 8°C cooler in the summer.
The coldest temperature in Verkhoyansk was -67.8°C, recorded in February 1892, making the difference between the min and max recorded temperatures an extraordinary 105°C. The June 2020 record of 38°C exceeded the previous record high of 37.3°C in July 1988.
These huge differences show that a record being exceeded by 0.7°C is not quite as significant as was reported. Latitude is a very poor predictor of seasonal temperatures and extreme temperatures are driven by other, much more dynamic factors that in turn drive significant variability and unpredictability. This shows the importance of context to understanding claims of radical environmental changes, such as extreme temperatures and heatwaves.
The IPCC finds that ‘It is virtually certain that there has been increases in the intensity and duration of heatwaves and in the number of heatwave days at the global scale’ and that ‘These trends likely occur in Europe, Asia, and Australia’ (Ch. 11.3.2) – but not in North America, and only ‘medium confidence in similar changes in temperature extremes in Africa and high confidence in South America’. The IPCC does not give a magnitude of these seemingly global changes in its estimation. Its claim that ‘Globally averaged heatwave intensity, heatwave duration, and the number of heatwave days have significantly increased from 1950–2011’ is not produced by searching for agreement in the literature, and cites just one study in support.
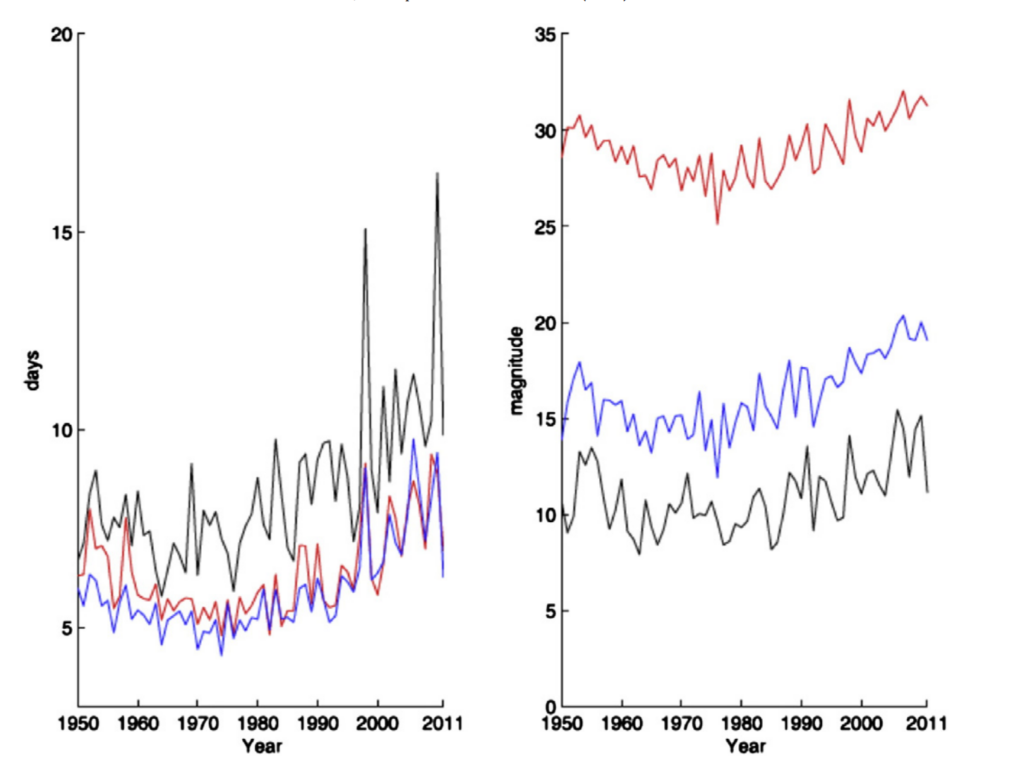
According to that study, data regarding heatwaves is difficult to both obtain and to process to produce a global picture. As the coloured lines on the below chart show, different methods produce radically different estimates of heatwave duration and magnitude. However, the study notes the similarity of the signals produced, which may help to explain why the IPCC are confident (‘virtually certain’) in their estimate, but give no measurement.
A more recent study by the same author makes more cautious statements than its predecessor and the IPCC. Though concluding that no statistically significant trend in heatwave intensity can be found, but arguing that ‘heatwaves are not only increasing but accelerating in the presence of anthropogenic climate change’, the paper advises that ‘a period of at least 3−4 decades to robustly assess changes in heatwaves, which is considerably longer than that proposed for average temperature trends’, i.e. that there is as yet insufficient data to draw ‘virtually certain’ conclusions from.
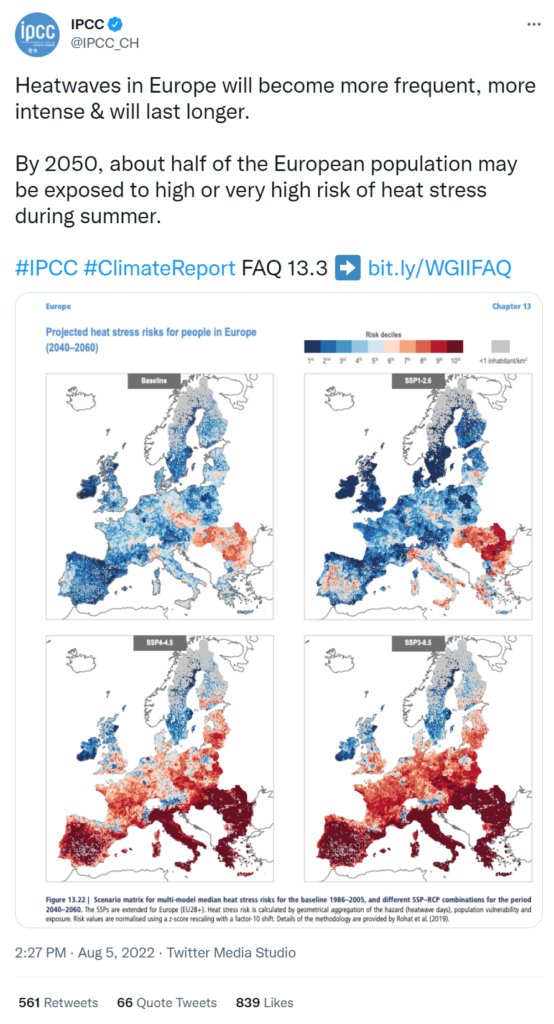
The problem of lack of data, particularly longer data series is an important limitation of science’s understanding, but which rarely gets discussed. Worse, scientific institutions themselves often omit such data to participate in political messaging. Tweets, like the below from the IPCC’s own social media account, do little to put the consequences of climate change into an objective context and more cautious framing.
The problem is that studies from which the IPCC draws its analysis do not examine eras earlier than 1950, such that a comparison between eras characterised by pre-industrial atmospheric CO2 concentrations and anthropogenic climate change can be achieved. This is particularly significant because the IPCC excludes North America from its estimate of the extent of global heatwave trends for the late 20th Century, where comparatively very good data exists about this region in both eras, which together seem to contradict the prevailing global picture, for which there is poor data.
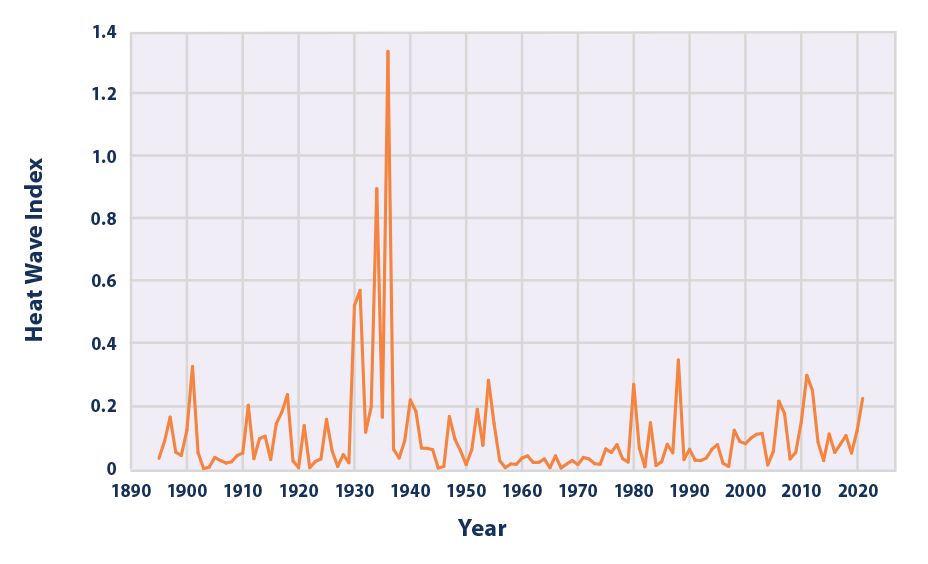
According to the US Environment Protection Agency (EPA), the 1930s saw a radical increase in the number of heatwaves. Though a small trend seems to be observable following a reduction in the heatwave index through the 1960s and into the 1970s, subsequent years are broadly similar to the early 20th Century and do not compare with the extraordinary increases in the 1930s.
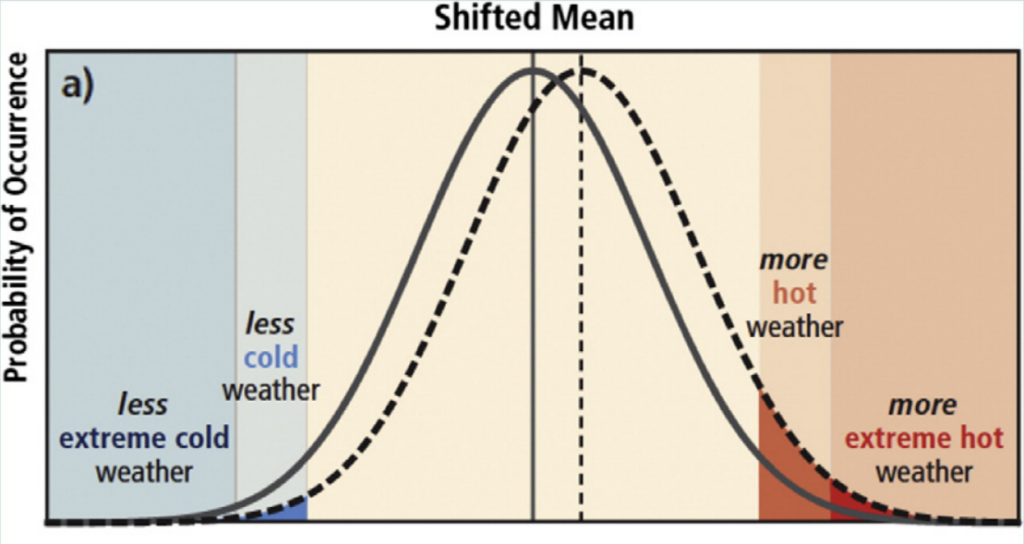
What this again demonstrates is that whereas regional or local measurements of heatwaves exist, a global measurement of heatwaves remains elusive and somewhat meaningless. In other words, natural decadal variation may be of greater significance than global warming, partly because global warming increasing heatwaves is a truism, but which also may be trivial for plausible degrees of global warming – it may merely shift temperatures so many degrees upwards, as is shown in this demonstration of the “shifted mean” hypothesis:
This is further shown by discussions about recent heatwaves affecting the UK. In 2022, a short heatwave but with seemingly unprecedented high temperatures drove intense commentary in the media and from science, largely attempting to frame the events in terms of climate change. A three-day heatwave on 17-19th July brought temperatures in some places slightly exceeding 40°C, inviting comparisons with the UK’s historic heatwaves, as shown by this graphic produced by the UK Meteorological Office (yellow and green boxes added).
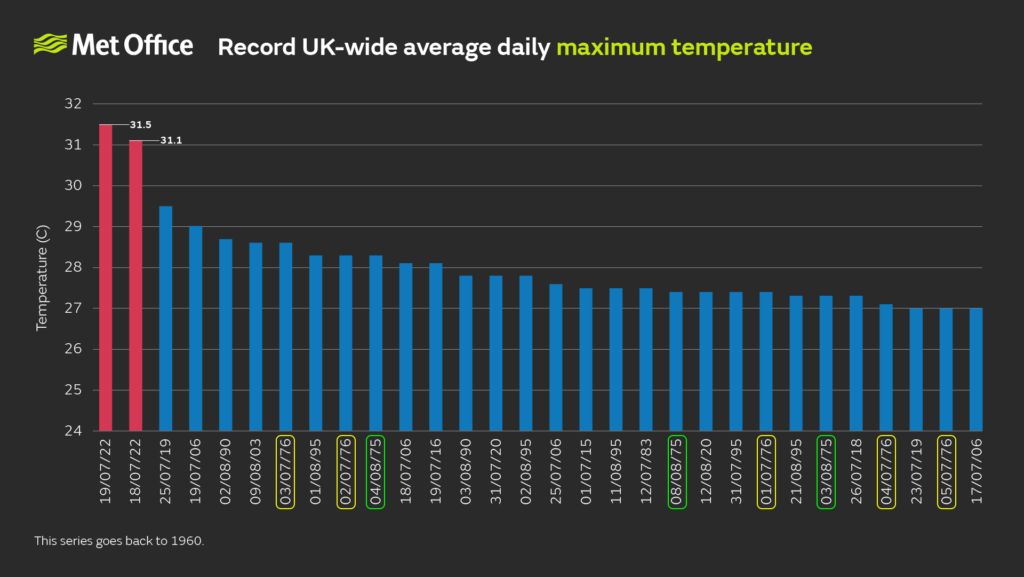
According to the Met Office’s analysis, the UK-wide average temperature was unprecedented, and far in excess of anything recorded previously. However, several things need to be observed about this claim. First, the data analysed goes back to 1960, which as discussed above may not be a sufficient series of data to make statements about long term climate change. Second, though the temperatures of July 2022 were certainly the highest, five of the 30 highest temperatures were on sequential days in 1976 and another three the previous year. No records were produced in the 1960s, only one was produced in the 1980s, and following 7 records in the 1990s, the 2000s and 2010s recorded only five each.
The heatwave of 1976 stands in history as an unprecedented event, which has confounded attempts to link heatwaves to anthropogenic climate change. And this in turn shows again the difficulty in producing an object metric to measure heatwaves with, and so to inform an understanding of their relationship (if any) with global warming. The Met Office explain that:
A UK heatwave threshold is met when a location records a period of at least three consecutive days with daily maximum temperatures meeting or exceeding the heatwave temperature threshold. The threshold varies by UK county.
One BBC article which attempted to “debunk” the heatwave “myth” that “It was hotter in 1976” claimed that, “the peak temperature in 1976 was 35.9C (96.6F), more than four degrees lower than the 40.3C recorded on 19 July”, and that “Nine out of 10 of the hottest days ever recorded in the UK have been since 1990, according to the Met Office. The hottest day from 1976 ranks as 13th in the list.” A second article by the BBC’s “Reality Check team” similarly emphasised 2022’s temperatures, and quotes Prof Hannah Cloke, a climate scientist at the University of Reading: “1976 was indeed a heatwave and we have had heatwaves before, but the point is they’re happening more often and they’re becoming more intense”.
But this claim about “intensity” is unquantified, and omits that the definition of a heatwave includes both magnitude and duration. Whereas the July 2022 heatwave lasted just three days – the minimum required to meet the definition – the 1976 heatwave began on the 23rd of June and ended just over two months later, on 27th of August, a total of 66 days, or 22 times the length of the 2022 heatwave. During this episode, a number of weather stations recorded more than two weeks of daily temperatures exceeding 30°C. A comparison of the two heatwaves that ignores one of the two fundamental characteristics of a heatwave – and to such an extent (a factor of 22) – renders the metric meaningless, and the emphasis can therefore be read as an attempt to align the data to a political narrative to which it otherwise would not fit.
This problem of delimiting data to suit narrative purposes has been pointed out by critics, albeit from an amateuer perspective. First, it seems that there is historical evidence of comparable (to 1976 and 2022) temperatures experienced during a heatwave in England in 1911, with some stations recording highs of 37.8°C in Greenwich, London. Second, the development of Greater London saw its population increase from 6.2 million in 1901 to 8.8 million in 2021, having implications for the Urban Heat Island effect on the temperature record. Third, whereas London had been a coal-powered industrial centre in the early Twentieth Century, by 2022 coal use has been abolished, leaving the city more exposed to incoming heat from the sun. And a fourth criticism observes that many of the new temperature records are produced at weather stations located very near airport runways.
Some of these criticisms are not in themselves a sufficient basis from which to claim that heatwaves are not as they seem, but they do indicate that care is needed when comparing individual events’ metrics across wide ranges of time. This problem is amplified when scientists, especially speaking to the public through the media, choose narrow timeframes to express their opinions. And this is all the more important when it is forgotten that heatwaves are a normal part of weather, and their causes are often simply meteorological – weather – rather than signs of climate change.
The record temperatures seen in 2022, and for that matter in 1976 and probably in 1911, were not directly attributable to climate change or global warming. As a more sober explanation of the July 2022 heatwave by the Met Office explained:
The heatwave in the UK and more widely across western Europe was associated with a naturally-occurring large-scale wave pattern in the northern hemisphere, with a chain of five high pressure regions around the globe, and heatwaves also being experienced during summer 2022 in China and the US.
And that:
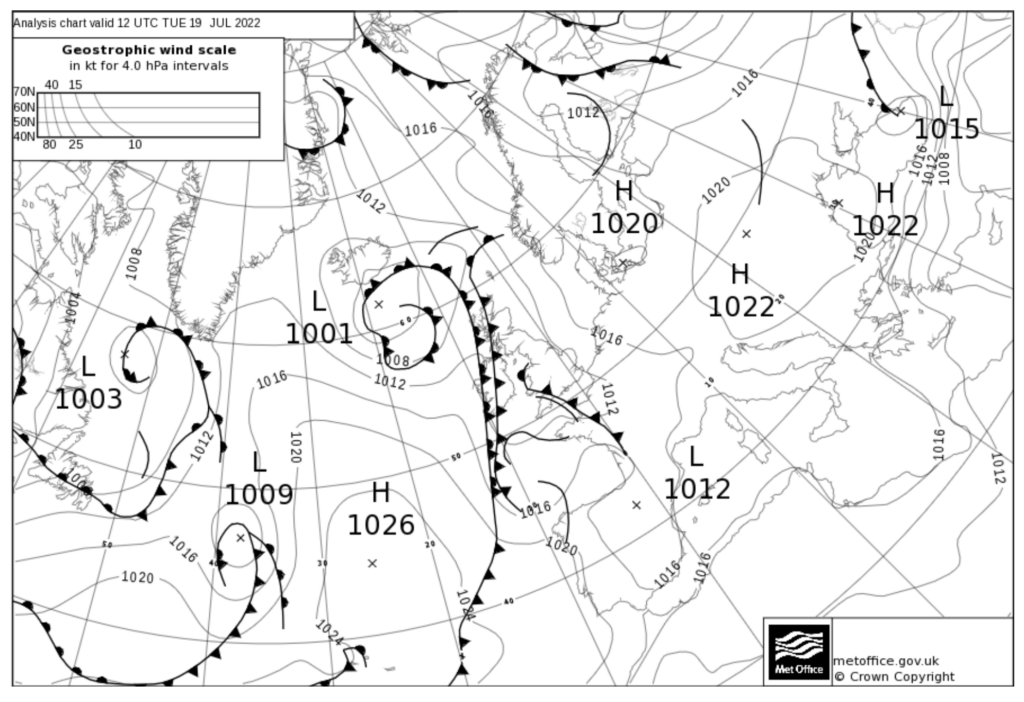
The analysis chart at 1200 UTC 19 July 2022 shows the UK located between high pressure over continental Europe and a low pressure system to the north west of Scotland resulting in a southerly flow drawing the hot, dry air airmass from southern Europe to the UK. The exceptionally hot weather was associated with a ‘heat-dome’; an area of high pressure with falling air in the atmosphere trapping warm air at the surface.
But by emphasising climate change rather than meteorology in their public communications, the Met Office and other scientists seem to have been obliged to omit detail from history and even from the definition of a heatwave. And as the above discussion demonstrates, the definition of a heatwave is based primarily on its context. Rare, but radically different heatwave events are possible at all latitudes, but are made to seem more unusual by limiting analyses to the late 20th and early 21st centuries, omitting historical context and other factors that influence temperature.