- Observations had shown a slight but not substantial increase in rainfall globally, but not in all regions. However, the latest data suggests even this is overstated.
- Some researchers have tried to use computer simulations to link increased extreme rainfall to global warming.
- Overall there is no evidential basis to link increased regional rainfall intensity to anything approaching a climate crisis.
According to meteorology, warmer air is capable of holding more moisture, therefore global warming will likely cause a more saturated atmosphere to make more water available to weather fronts, increasing the volume of precipitation (rain).
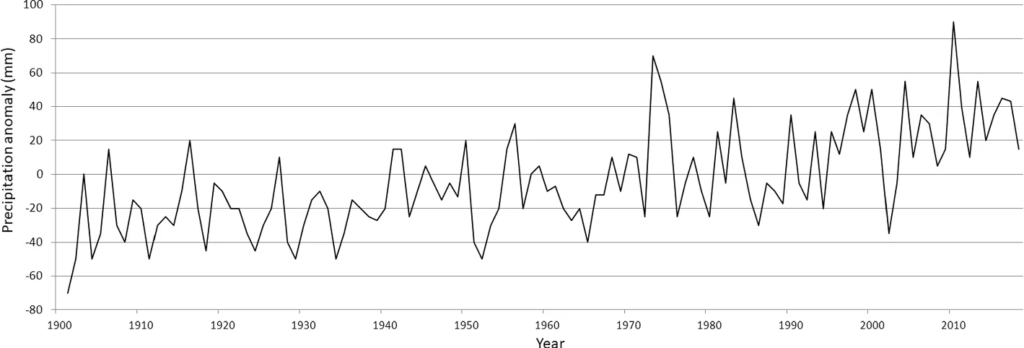
This proposition is uncontroversial, leading to little debate, perhaps because its consequences are not clearly significant. For example, a 2022 study published in The European Physical Journal Plus, which is popular with climate sceptics, reproduces the IPCC’s finding, saying that “Global observational datasets indicate an increase in total annual precipitation”, and the below chart depicting the global yearly precipitation anomaly, compared with the 1961-1990 average, which appears to show a trend since the 1970s. What is of consequence, many commentators point out, is the flooding that this may cause. Flooding is considered separately on this website, but briefly, the IPCC itself observes that “heavier rainfall does not always lead to greater flooding”, and that “there is low confidence in the human influence on the changes in high river flows on the global scale”.
This is an unsurprising result when the global precipitation anomaly that consensus science seems to have observed is compared to local precipitation statistics. As the following chart of Central England rainfall shows, 30mm represents a very small change in total precipitation, and is itself a fraction of the inter-annual variation. One of the driest years on record, for example, was 2011, in which 443 mm of rain fell. This was immediately followed by one of the wettest, in which there was 876 mm of rain – a difference on the preceding year of 433mm, or nearly 15 times a high-end estimate of the global increase in precipitation. Moreover, as the red linear trendline shows very clearly, there is simply no detectable trend in Central England annual rainfall statistics, despite many headlines and campaigners claiming that conditions of both drought and increased rainfall are the “new normal” for the region, brought about by climate change.
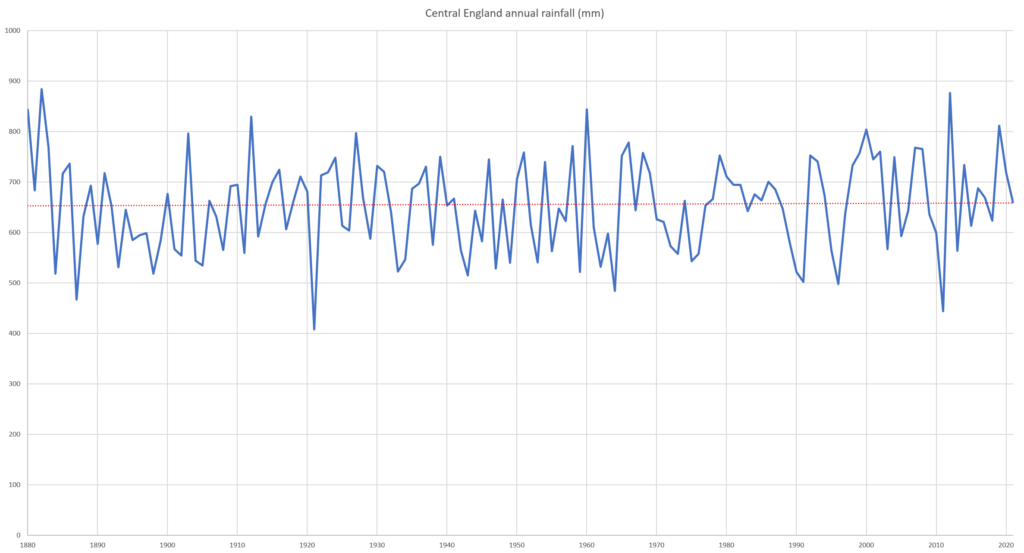
Central England is not the whole world, of course, and its rainfall statistics showing no obvious climate change impact may just be chance. But what this does do is provide statistical perspective by which the putative impacts of climate change can be understood. Whereas climate change is routinely expressed as an “emergency” or “crisis”, the reality of global changes is trivial, whereas local changes show much greater variability at most timescales.
As with other simple climate metrics that show little radical change in the era of climate change, some have sought to find evidence of increasingly extreme climate change indicators within data that otherwise does not show it. For example, a recent Met Office overview of its State of the Climate report claims that,
The number of days where rainfall totals exceed 95% and 99% of the 1961-1990 average have increased in the last decade, as have rainfall events exceeding 50 mm. Both these trends point to an increase in frequency and intensity of rainfall across the UK.
But careful reading of these claims reveal first an unquantified statement of an increase in rainfall “in the last decade”. And second, the claim that “rainfall events exceeding 50 mm” have increased is taken from a 2021 study that uses a climate simulation, not observational data, to detect such events, and to find an increase since 1961. The study finds that the months October to December (OND) show the most sensitivity to events of this kind:
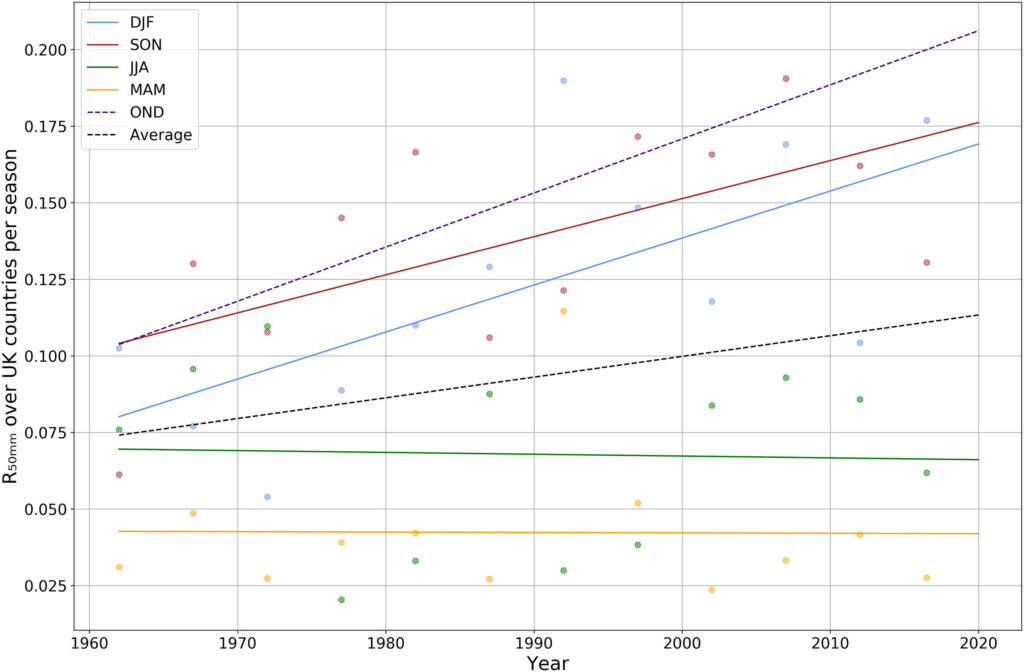
However, the paper admits that this vast variability exists between different regions of the UK:
Daily totals of over 50 mm in OND are very rare in the east of England, having occurred once or less in over 125 years in most grid boxes, but can occur between 1.0 and 3.5 times a year in parts of Scotland and Wales.
The difference between the frequencies of such events at two places within the UK, separated by just a few hundred miles, is at least a factor of 325. On any rational perspective, the attempt to treat parts of the UK as one, when such radically different climates exist within it, is highly likely to produce misleading conclusions. The metric of days with rainfall exceeding 50mm is therefore almost certainly functionally useless. It says nothing useful about the UK’s sensitivity to climate change.
In other words, there is little for someone in the east of England to be concerned about the increased incidence of an event which occurs “once or less in over 125 years”. And where such events occur “between 1.0 and 3.5 times a year”, an increase in their occurrence, even a doubling, may not represent an increase in “extreme weather” but an increase in normal weather. Moreover, given the short range of the data series, it is not clear that the changes seemingly detected by this study represent a departure from or return to the mean of historical weather: what was the weather like in the era before 1961?
Rainfall no doubt can create significant problems for society. But even knowing that the risk of extremely rare weather events has been multiplied makes little to no difference to the jobs of civil planners, who must prepare for all plausible outcomes, be they once in a century or now twice in a century events. And the means to control excess water is well within most countries’ – and especially the UK’s – reach. Dealing with it is entirely an engineering problem, as is discussed in other sections in this site, rather than a ‘crisis’ that we are helpless in the face of. Meanwhile, the evidence for change in rainfall amounts, though definitive in the IPCC’s and UK climate scientists’ view, are neither radical nor unprecedented types of events.
Update
A recent study published in Journal of Hydrology via Science Direct in May 2023 suggests that the previous consensus that there had been recent increases in rainfall globally is not the full story. Whilst according to Demetris Koutsoyiannis (2020) the highest frequency of intense rainfall events did occur between 1960 and 1980, the new study using Integrated Multi-Satellite Retrievals for Global Precipitation Measurement (IMERG) between 2001 and 2020 indicates that there have been either significant decreases or ‘non-significant increasing trends’ in the intensity of precipitation. The Zhang et al study does also find (as one might expect) regional differences but it is also suggested that their work ‘provides an alternative perspective on the climatology and changing features of precipitation’.
It is increasingly clear that any claims related to increased intensity of precipitation at a global level do not amount to clear evidence of significant climate change, let alone evidence of anything approaching a climate emergency.